What Is Unsupervised Learning? How It Works and Examples
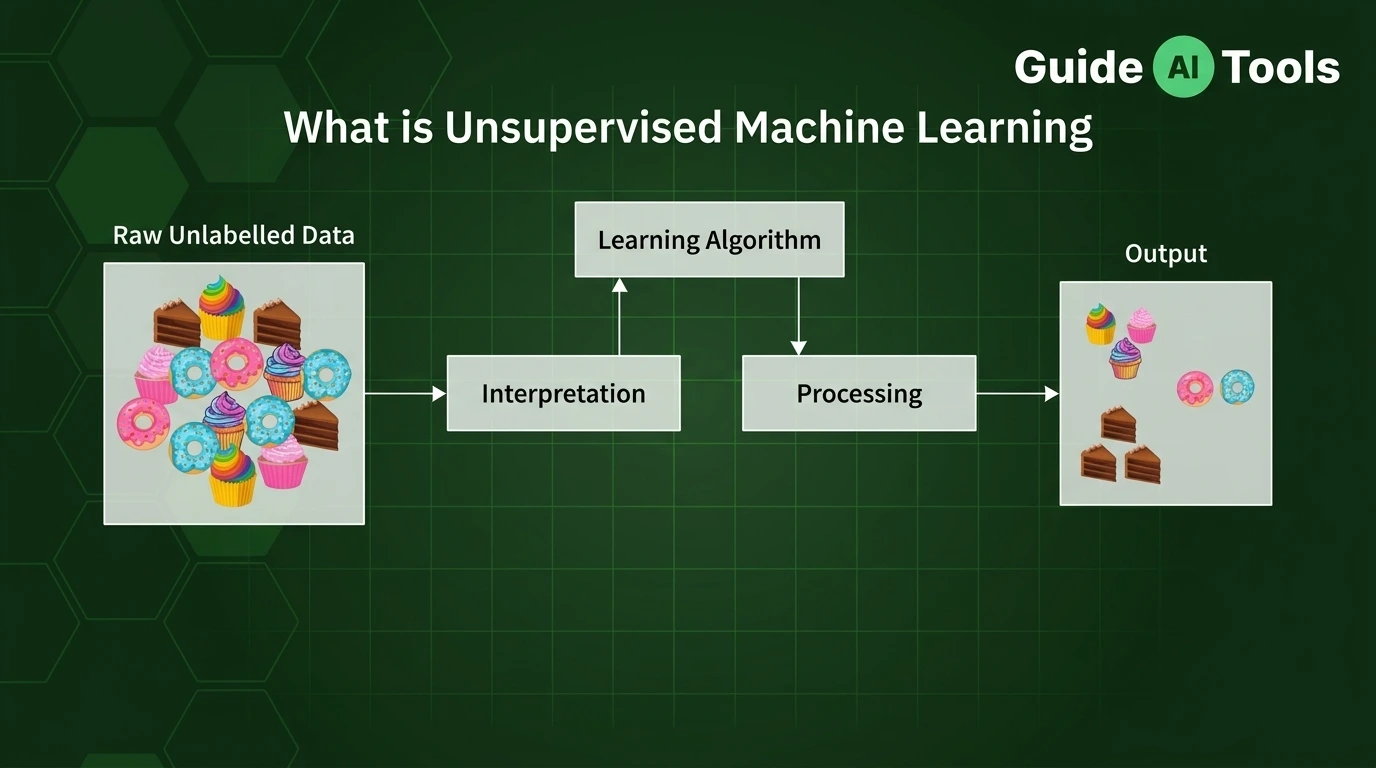
Unsupervised learning is a type of machine learning
where an algorithm works with data that has no predefined target labels. Instead of learning to reproduce known answers, it searches for useful structure within the data, such as groups, relationships, lower-dimensional representations, or unusual observations.
Look, most beginner tutorials make this sound like computational sorcery. They tell you the model magically discovers hidden truths without any human input. From what I have seen in real production pipelines, that framing misses the actual engineering reality.
No labels does not mean no human choices. The algorithm searches for structure according to mathematical rules, but you still decide what data enters the pipeline, how distance is calculated, and what counts as meaningful.
Understanding these mechanics saves you from burning computing credits on useless outputs. Here is how it actually works under the hood.
What Is Unsupervised Learning in Simple Terms?
Imagine you own an e-commerce platform with 50,000 active customer accounts. You have detailed records of purchase frequencies, total dollars spent, refund rates, and product categories visited, but no column in your spreadsheet tags customers as “loyal VIPs” or “bargain hunters.”
That missing column is your target label. Without it, you cannot train a traditional classifier to predict customer categories.Stanford HAI’s definition of unsupervised learning
highlights how models analyze these unlabeled data points to identify natural patterns and relationships. The algorithm evaluates every customer profile simultaneously, placing people with similar buying habits into mathematical groups.
A human analyst then examines those groupings to see if they correspond to real-world behavioral segments. The algorithm builds the structure. You provide the business context.
What Does “Unsupervised” Actually Mean?
In supervised setups, every training sample comes with a known target variable often designated as y. The algorithm makes a guess, compares its output to the true label, and calculates its prediction error.
Unsupervised workflows have no target variable y. There are no right or wrong answers provided during training, which means the model never receives explicit feedback on individual predictions.
But do not confuse the absence of labels with an absence of mathematical objectives. K-means still minimizes squared distances to cluster centers, and principal component analysis still maximizes variance across projected directions.
The term unsupervised simply means human annotators did not tag the dataset beforehand. You still set the hyperparameters, choose the feature set, and define the distance metric.
No labels does not mean no assumptions. Every algorithmic choice you make shapes the final result.
How Does Unsupervised Learning Work?
Building a working pipeline requires moving through a structured series of engineering steps. Skipping any step early in the process creates distorted outputs that ruin your downstream analysis.
First, you define your exploratory objective and gather your raw feature set. You must clean missing values and convert qualitative variables into numerical representations.
Next, you apply feature scaling so large numbers do not overpower smaller variables. You then choose an appropriate distance metric or structural objective that matches your data shape.
Finally, you fit the algorithm, evaluate structural stability, and interpret the resulting patterns.
- Gather raw observation features without target outputs.
- Handle missing entries and remove irrelevant metadata fields.
- Normalize numerical ranges so features contribute equally to calculations.
- Select a distance metric like Euclidean distance or cosine similarity.
- Run the algorithm to minimize error or maximize statistical variance.
- Evaluate group separation using internal mathematical checks.
- Translate raw mathematical outputs into practical business insights.
What Are the Main Types of Unsupervised Learning?
Different business problems require different mathematical approaches to uncover structure. Trying to force every problem into a clustering pipeline is a common mistake among junior data teams.
The four main functional families address distinct data organization tasks.
| Approach | What It Tries to Find | Practical Example |
| Clustering | Naturally occurring groups of similar observations | Segmenting store locations by sales volume patterns |
| Dimensionality reduction | Compact representations of high-dimensional datasets | Compressing 200 customer features into 5 latent components |
| Association rules | Frequently co-occurring items or event attributes | Identifying products commonly bought together in one basket |
| Anomaly detection | Observations that deviate significantly from baseline behavior | Flagging unusual server traffic spikes before an outage occurs |
Knowing which family fits your problem keeps your model aligned with your technical goals.
What Is Clustering?
Clustering partitions an unlabeled dataset into distinct subsets where observations within the same group share strong mathematical similarities. Points sitting in different groups remain as far apart from each other as possible.
Classification assigns data to predefined categories. Clustering creates brand-new groupings based entirely on similarity scores.
In hard clustering, every single data point belongs to exactly one group. Soft or probabilistic clustering allows points to hold fractional membership probabilities across multiple groups simultaneously.
Google defines clustering as grouping unlabeled examples according to mathematical similarity. In practice, you might group news articles by topic vocabulary without defining the topics in advance.
The algorithm does not know an article is about politics or sports. It only knows certain words appear together with predictable mathematical frequency.
Why Similarity Matters More Than People Think
Before an algorithm can group similar records, someone has to decide what “similar” means in mathematical terms. That decision fundamentally alters your model output.
If you measure customer similarity using age and income, your output reflects demographic proximity. If you measure similarity using website click paths and cart abandonment rates, your output reflects user intent.
Euclidean distance measures straight-line physical separation between data points in geometric space. Cosine similarity evaluates the angle between vectors, making it far better for text processing where document length varies.
In my testing, changing your distance metric completely reshapes your output clusters even when your underlying dataset stays identical.
Change the definition of similarity and you change the clusters. Always align your similarity metric with your actual domain logic.
What Is Dimensionality Reduction?
High-dimensional datasets containing hundreds of features create severe computational headaches. As feature counts grow, data points spread sparsely across geometric space, making distance calculations far less meaningful.
Dimensionality reduction compresses large feature sets into lower-dimensional representations while preserving as much structural information as possible.
It helps eliminate redundant, highly correlated variables that slow down processing pipelines. It also allows developers to plot complex multi-variable datasets onto two-dimensional or three-dimensional charts for visual inspection.
Principal Component Analysis, or PCA, is the most common technique for this task. It finds new orthogonal directions called principal components that capture maximum variance across your data.
PCA does not simply delete columns from your spreadsheet. It projects your original features onto a completely new mathematical coordinate system.
What Are Association Rules?
Association rule learning searches for interesting relationships and co-occurrence patterns hidden inside large transaction databases. It identifies conditional rules that describe how frequently items appear together.
Retailers use this approach for market basket analysis to optimize store layouts and digital recommendation engines.
- Support measures how frequently an item set appears across your entire database.
- Confidence calculates the conditional probability that a customer buys Item B given that they already placed Item A in their cart.
- Lift measures how much more frequently two items appear together compared to what you would expect if they were completely independent.
- The Apriori algorithm scans transaction logs by iteratively expanding frequent item sets.
Keep in mind that association rules indicate statistical co-occurrence rather than direct cause and effect. A high lift score proves two products sell together, not that buying one forces the purchase of the other.
How Does Unsupervised Anomaly Detection Work?
Anomaly detection identifies rare observations that differ significantly from the majority of your dataset. These unusual observations are often called outliers.
In an unsupervised setup, the model learns the baseline statistical distribution of normal behavior. It then scores new data points based on how far they fall outside that learned baseline.
Isolation Forest is a popular algorithm built specifically for this task. It isolates individual observations by randomly selecting features and splitting value ranges.
Anomalies require fewer random splits to isolate because they sit far away from dense data clusters. Normal data points require many recursive splits to isolate completely.
Unusual is a mathematical property; fraud is a business label. An anomaly detector flags weird behavior, but a human expert must verify whether that behavior represents fraud, system glitches, or a high-value edge case.
Common Unsupervised Learning Algorithms
Choosing the right algorithm depends on your dataset size, noise level, and expected cluster geometry. Each algorithm brings distinct mathematical assumptions that limit where it can be deployed safely.
| Algorithm | Primary Use | Main Limitation |
| K-means | Fast partitioning of compact clusters | Requires setting k in advance and struggles with irregular shapes |
| Hierarchical clustering | Building nested tree structures of data groups | Computationally expensive on datasets with over 100,000 records |
| DBSCAN | Finding arbitrary cluster shapes based on density | Fails when cluster densities vary wildly across the dataset |
| Gaussian Mixture Models | Soft, probabilistic clustering with flexible boundaries | Highly sensitive to initial parameter conditions and local minima |
| PCA | Linear dimensionality reduction and feature projection | Cannot capture complex non-linear relationships in data |
| Isolation Forest | Unsupervised anomaly and outlier detection | Struggles when anomalous points cluster tightly together |
If your data forms non-spherical shapes, k-means fails because it calculates distances from central points called centroids. DBSCAN handles irregular shapes much better by connecting dense regions of points.
Match algorithm assumptions against your data distribution before launching production training runs.
Unsupervised Learning Example From Start to Finish
Let us walk through a complete customer segmentation workflow to see how these concepts connect in practice.
Suppose you manage a subscription service with 100,000 active user profiles. You want to identify distinct user tiers to tailor your product messaging.
First, you extract user behavior metrics like login frequency, content consumption hours, support ticket volume, and monthly account billing. You drop uninformative identifiers like user email addresses and phone numbers.
Next, you apply feature scaling so billing amounts do not overpower login counts. You run k-means across a range of k values, evaluating total within-cluster variance to find the optimal cluster count.
- Clean missing values and remove non-numeric user IDs.
- Scale features using standardization so every metric contributes equally.
- Compute inertia values across cluster counts from k=2 to k=10.
- Plot the results on an elbow chart to identify the point of diminishing returns.
- Select k=4 based on the elbow curve inflection point.
- Fit the k-means model to generate four cluster assignments.
- Calculate mean feature values for each cluster to profile user behaviors.
Your final output reveals four distinct user profiles: casual weekend viewers, power daily users, low-engagement subscribers, and high-support account managers.
Notice that the algorithm never generated those descriptive titles. The algorithm output four mathematical groups; your product team provided the contextual names.
How Do You Evaluate Unsupervised Learning Without Labels?
Evaluating supervised models is straightforward because you compare predictions directly against true target values. Evaluating unsupervised models is much harder because there is no ground truth answer key.
You cannot compute standard accuracy scores, precision, or recall without reference labels. Instead, you rely on internal mathematical metrics and practical validation checks.
| Evaluation Metric | What It Measures | How to Interpret It |
| Silhouette score | Distance between a point and its cluster compared to neighbor groups | Scores near +1 indicate well-separated clusters |
| Within-cluster inertia | Total sum of squared distances from points to their assigned centroid | Lower values mean tighter, more compact clusters |
| Cluster stability | Consistency of discovered groups across random data subsets | Stable models produce matching clusters across multiple runs |
| Downstream usefulness | Improvement in secondary task performance using discovered features | Measures if new groupings actually help practical workflows |
Google warns that assessing clustering quality without ground truth requires checking internal compactness, separation, and real-world utility simultaneously.
A high silhouette score proves your clusters are geometrically separated. It does not prove those clusters will help your marketing team increase conversion rates.
Never confuse mathematical separation with business utility. Always validate your quantitative cluster metrics against actual domain expertise.
Why Data Preparation Can Change the Result
Data preparation dictates what your model learns. In unsupervised learning, preprocessing can change the structure the algorithm thinks it sees.
Consider a dataset containing user age ranging from 18 to 80, and annual income ranging from $20,000 to $500,000. If you feed raw numbers into Euclidean distance algorithms, income values dominate the calculation by pure numerical scale.
An income difference of $10,000 completely dwarfs an age difference of 40 years. Your algorithm ends up clustering customers strictly by income while ignoring age differences entirely.
Standardizing both features to zero mean and unit variance balances their influence.
Unscaled Distance: sqrt((Age1 - Age2)^2 + (Income1 - Income2)^2)
Result: Income dominates calculation due to raw magnitude.

Scaled Distance: sqrt((Z_Age1 - Z_Age2)^2 + (Z_Income1 - Z_Income2)^2)
Result: Both features contribute equal weight to similarity.
Handling extreme outliers is equally important. A single extreme outlier pulls k-means centroids away from real data clusters, distorting your entire partition map.
Fix your scaling and clean your outliers before tuning your algorithm parameters.
Real-World Examples of Unsupervised Learning
Unsupervised algorithms power critical infrastructure across modern digital platforms, operating quietly behind everyday software interfaces.
Companies use these techniques to organize unstructured text, compress multimedia files, and detect suspicious platform activity.
- Streaming platforms group users with similar viewing histories to build personalized content recommendation feeds.
- Financial institutions apply Isolation Forest models to flag unusual credit card transactions occurring in foreign locations.
- Genetics researchers use hierarchical clustering to group gene expression profiles and discover disease sub-types.
- Security tools process server logs to detect unusual network traffic patterns that signal potential zero-day cyber attacks.
- Search engines organize millions of news articles into topical clusters without human editorial tagging.
If you want to understand how these systems connect to wider technical frameworks, check out our guide on how AI works.
Advantages of Unsupervised Learning
Unsupervised workflows offer unique advantages when dealing with vast, unorganized datasets where manual annotation is impossible.
They allow you to analyze data immediately without spending thousands of dollars hiring human annotators. They excel at exploratory data analysis, uncovering unexpected relationships that human analysts might never think to look for.
- Removes the massive cost and time overhead of manual data labeling.
- Uncovers unexpected structural patterns that human domain experts overlook.
- Works directly on raw, unannotated data streams as they enter your database.
- Reduces high-dimensional feature spaces to speed up downstream models.
- Serves as a valuable preprocessing step for hybrid machine learning pipelines.
These strengths make unsupervised techniques essential for initial data exploration.
Limitations of Unsupervised Learning
Despite its flexibility, unsupervised learning comes with severe operational limitations that frustrate engineering teams expecting automated solutions.
Discovered patterns are often noisy, highly sensitive to parameter choices, and difficult to validate objectively.
K-means works poorly when cluster shapes are irregular, densities vary strongly, or outliers distort centroids. Finding a pattern is not the same thing as finding a useful truth.
- Results can be highly ambiguous and difficult to interpret without domain experts.
- Small changes in feature scaling or distance metrics produce completely different outputs.
- No direct accuracy metrics exist to verify if discovered groups reflect real-world facts.
- High computational requirements make some algorithms slow on large datasets.
- Risk of finding spurious mathematical noise rather than meaningful structural patterns.
Understanding these failure modes prevents your team from making bad strategic bets based on unstable model outputs.
Supervised Learning vs Unsupervised Learning
Understanding the differences between these two foundational paradigms helps you select the right approach for your project goals.
While both methods analyze feature relationships, they use different inputs, training goals, and evaluation workflows.
| Feature | Supervised Learning | Unsupervised Learning |
| Input data | Labeled dataset containing explicit targets | Unlabeled dataset containing features only |
| Core objective | Predict target outputs for new unseen inputs | Discover underlying structure, groups, or rules |
| Human guidance | High (requires manual annotation upfront) | Low (requires design choices and interpretation) |
| Output type | Discrete classes or continuous numbers | Clusters, lower-dimensional spaces, or rules |
| Primary algorithms | Linear regression, Random Forest, SVM | K-means, PCA, DBSCAN, Isolation Forest |
| Evaluation metric | Accuracy, RMSE, Precision, Recall, F1-score | Silhouette score, Inertia, Downstream performance |
For a detailed dive into target-driven workflows, read our guide on supervised learning
. You can also see how these methods fit into the broader landscape by reading about types of machine learning.
Unsupervised Learning vs Self-Supervised Learning
People often confuse traditional unsupervised learning with modern self-supervised learning because neither uses manual human labels. But they operate on fundamentally different principles.
Traditional unsupervised learning searches for natural structure without creating target answers.
Self-supervised learning creates artificial prediction tasks directly from raw input data. For example, a model hides a word in a sentence and attempts to predict it using surrounding text context.
Self-supervised pre-training allows large language models to learn syntax and world knowledge before human fine-tuning.
Traditional unsupervised learning groups or compresses data. Self-supervised learning generates pseudo-labels to train predictive representations automatically.
When Should You Use Unsupervised Learning?
Knowing when to deploy unsupervised learning saves your team from applying complex algorithms to simple problems.
Deploy unsupervised methods when your data lacks target labels and your goal is exploratory. It is ideal when you want to discover customer segments, simplify high-dimensional features, or flag unusual system activity.
Do not use unsupervised learning if you already know the exact target output you want to predict. If you have labeled data and need precise predictions, supervised learning remains the superior choice.
If you know the answer column you want to predict, start with supervised learning. If you are trying to understand what structure exists before defining an answer column, unsupervised learning fits better.
FAQs
What is unsupervised learning in one sentence?
Unsupervised learning is a machine learning approach that searches for hidden structure, relationships, or groupings in data without relying on predefined target labels.
Does unsupervised learning use labeled data?
Traditional unsupervised learning does not use target labels, though it still requires structured observation features to calculate data similarity.
What are the main types of unsupervised learning?
The main operational families include clustering, dimensionality reduction, association rule learning, and anomaly detection.
Is k-means supervised or unsupervised?
K-means is an unsupervised clustering algorithm that partitions data points into k groups by minimizing distance to cluster centroids.
Is PCA unsupervised learning?
PCA is an unsupervised dimensionality reduction technique that projects data onto principal components capturing maximum variance without using target labels.
How do you test an unsupervised model?
You evaluate models using internal metrics like silhouette scores, cluster stability checks, domain expert reviews, and downstream application performance.
Can unsupervised learning detect fraud?
Unsupervised models can flag unusual transaction patterns as anomalies, but human investigators must verify whether those anomalies represent actual fraud.
Is anomaly detection always unsupervised?
Anomaly detection can be supervised, semi-supervised, or unsupervised depending on whether pre-labeled historical fraud records are available.
Does unsupervised learning mean AI teaches itself?
No, the algorithm operates without target labels, but human engineers still design feature sets, select distance metrics, set parameters, and interpret outputs.
Is deep learning unsupervised learning?
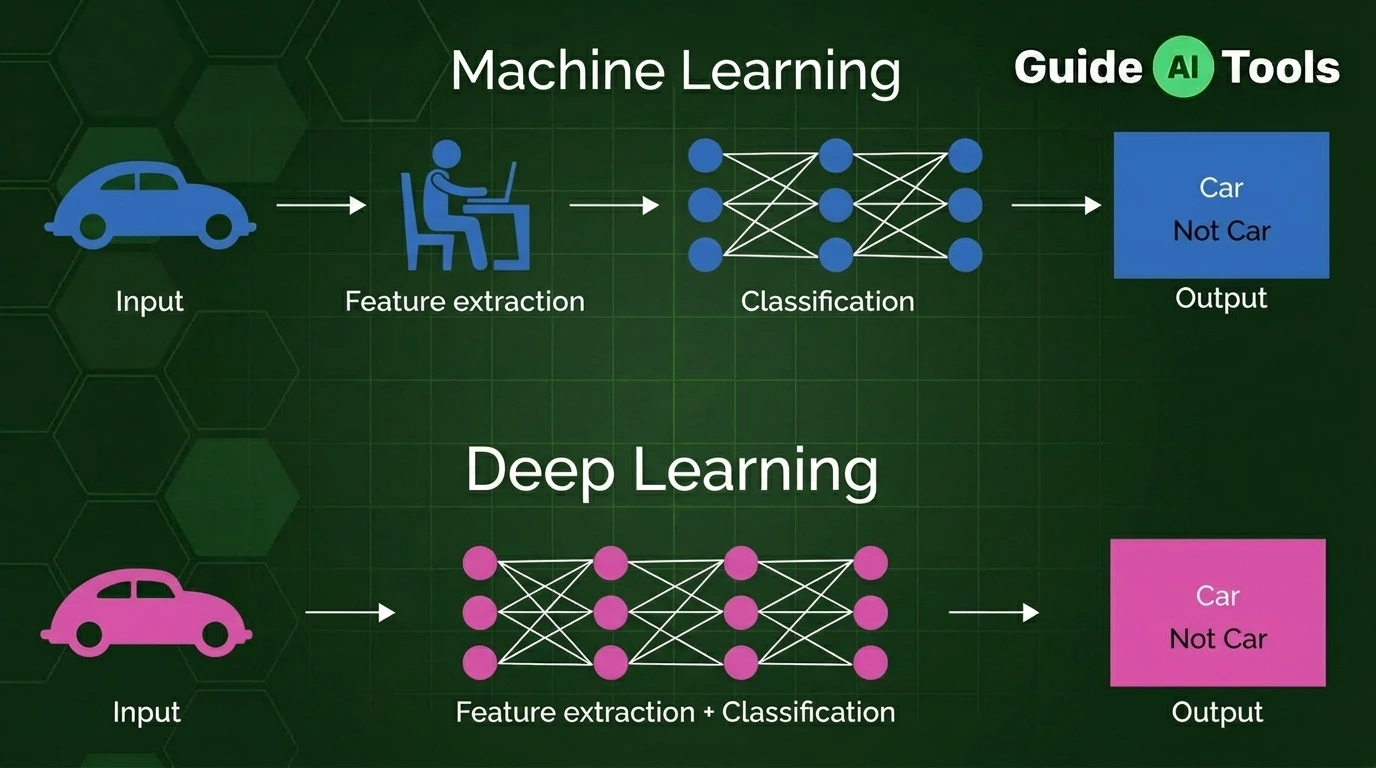
Deep learning is a neural network technique that can be applied across supervised, unsupervised, or self-supervised learning objectives.
You can learn more about these underlying computational structures by reading our explainer on neural network architectures.
What is the biggest disadvantage of unsupervised learning?
The biggest challenge is evaluation, as the lack of ground truth labels makes it hard to prove whether discovered patterns are genuinely useful or mathematically spurious.
Can unsupervised learning give the wrong answer?
Yes, algorithms can produce misleading or useless groupings if feature scaling is bad, distance metrics are mismatched, or initial parameter assumptions fail.
Finding Value in Unlabeled Data
Unsupervised learning is useful precisely because the answer key is not supplied beforehand. But that mathematical freedom comes with a clear engineering trade-off.
An algorithm can reveal underlying mathematical structure, but it cannot guarantee that structure carries practical business meaning.
Successful deployments depend on careful feature selection, proper scaling, realistic algorithm choices, and rigorous human domain interpretation.
Start by exploring your raw data structure, validate your distance assumptions early, and make sure your team tests cluster stability before launching models into production workflows.

Related Blog Posts